NJ17
34/40
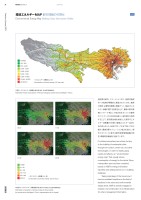
WORKSFeature | Annual 2013NSRI低炭素化都市、スマートシティなど、持続可能都市への転換が積極的に推進されています。施策の効果・必要性を簡便に把握すべく、NSRIのエネルギー情報に関する知見をもとに、最新の都市情報(ビッグデータ)例として株式会社ゼンリンの建物ポイントデータ(住宅地図を基軸とした建物情報)を活用することで、東京都全域を対象とした都市のエネルギー消費量の可視化「環境エネルギーMAP」を作成しました。NSRIでは、これまで培ってきた都市・環境分野のソリューション能力を活かし、都市マネジメントに資する都市経営情報基盤の研究・構築等を積極的に進めています。Countries everywhere are actively turning to the building of sustainable cities through low-carbon, smart-city, and other technologies. In order to readily grasp needs and effects, an “environmental energy map” that visually shows consumption of energy for the whole Tokyo metropolitan area has been compiled, based on NSRI’s energy information expertise and utilizing Zenrin, Inc.’s building database. Taking advantage of the know-how it has accumulated heretofore in the field of solutions in the urban and environmental design areas, NSRI is actively engaged in research and construction of an infrastructure for urban management information.環境エネルギーMAP 都市情報の可視化Environmental Energy Map Making Urban Information Visible08:0011:0014:0020:00年間の一次エネルギー消費量の推計値(東京:民生部門建物起因)Estimated Annual Consumption of Primary Energy (by private sector buildings in Tokyo) 時刻別の一次エネルギー消費量推計値(東京8月代表日:民生部門建物起因)Estimated consumption of primary energy by time bracket (by private sector buildings in Tokyo, representative day in August) 一次エネルギー消費量(GJ/時)Consumption of primary energy (GJ per hour)10未満10–5050–100100–150150–200200以上一次エネルギー消費量(GJ/年)Consumption of primary energy (GJ per year)100未満100–500500–2,0002,000–3,0003,000–5,0005,000–7,0007,000–15,00015,000–20,00020,000以上342013 Winter 17
元のページ