Cost Management Report
January-March 2026 issue.
「Construction Costs are Rising, but Heading Toward Stabilization」
Scroll Down
This report has been prepared by the Cost Management Group of the Architectural Design Dept. of Nikken Sekkei Ltd for information purposes. While the information herein is current as of the date of publication, its completeness is not guaranteed. The contents are subject to change without notice. Unauthorized reproduction of this report is prohibited.
Construction Costs are Rising, but Heading Toward Stabilization
The 2025 construction cost rate of increase halved vs. the prior year
Factors driving equipment installation costs shift from labor to materials and specialized construction work
-
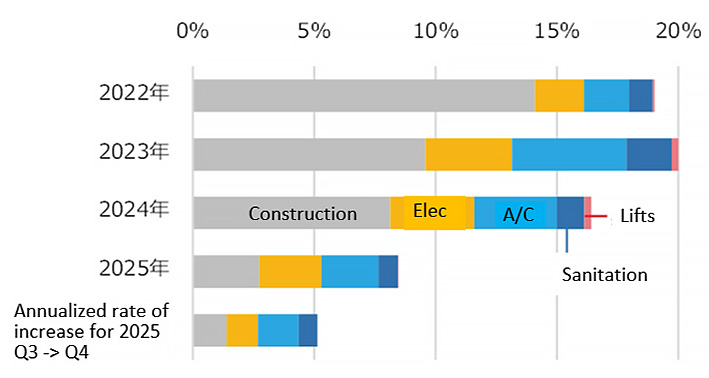 Fig. 1: Annual increase in NSBPI*1
Compiled by Nikken Sekkei.
-
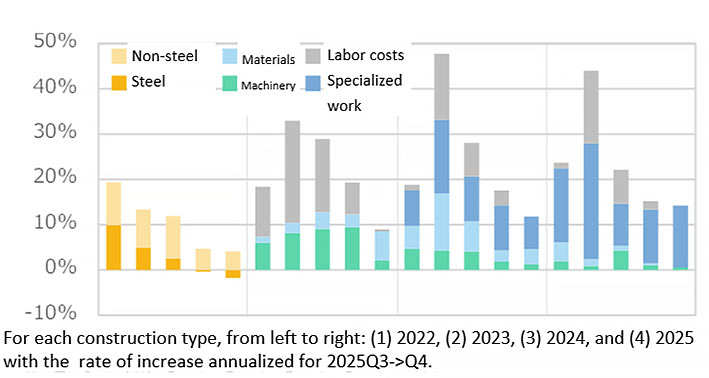 Fig. 2: Trends in Annual Rates of Increase and Contribution of NSBPI by Construction Type
Trends in Annual Rates of Increase and Contribution of NSBPI by Construction Type
Full-year forecasts for completed construction profit margins have been revised upward
The gap between the NSBPI and corporate and consumer price indices has narrowed
-
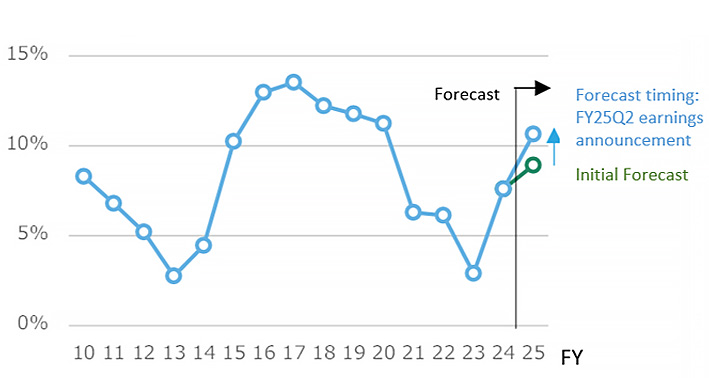 Fig. 3: Trends for Avg. Completed Project Profit Margins at Four Major General Contractors
Prepared from each company's financial data. -
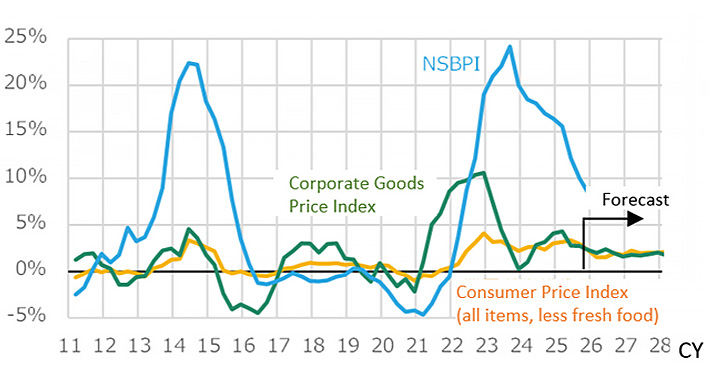 Fig. 4: Year-on-Year Changes in NSBPI and Price Indices (Corporate and Consumer)
Compiled from Nikken Sekkei, the Bank of Japan's Corporate Goods Price Index, the Statistic Bureau of Japan's Consumer Price Index, and the Japan Center for Economic Research (JCER)'s Short-Term Economic Forecast. Forecasts are from JCER.
Quarter-on-quarter Growth Slows to Around 1%
Nikken Sekkei Standard Building Price Index NSBPI*1
-
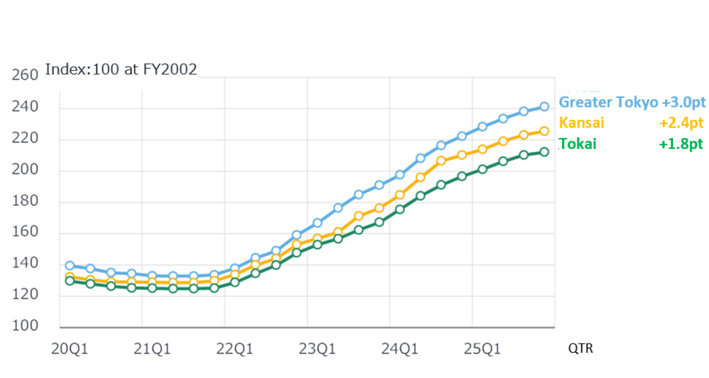 Fig. 5: Change in NSBPI
-
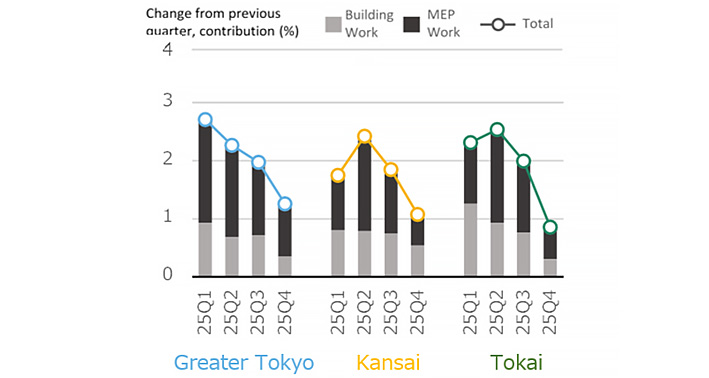 Fig. 6: Percent Change in NSBPI & Building Work, MEP Work Contributions
Additional ready-mix concrete price hikes seen this year in Osaka, next year in Tokyo
Labor shortage concerns remain high
-
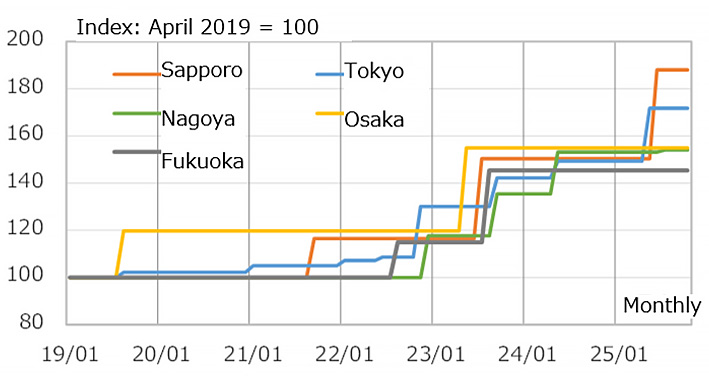 Fig. 7: Ready-mixed concrete price trends
Created from the Economic Research Association's Estimation Data.
-
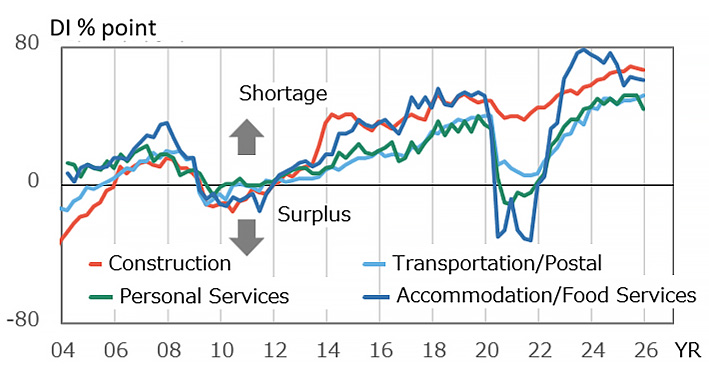 Fig. 8: Employment Outlook DI Trends (Large Firms)
Created from the Bank of Japan's Short-Term Economic Survey of Enterprises (Tankan).
*1: Nikken Sekkei Standard Building Price Index (NSBPI): An index showing price movements in construction prices, calculated independently by Nikken Sekkei Ltd. Using standard rental office space as a quantitative model, the index is calculated and converted into an index of construction prices that reflect prevailing prices, as identified through independent surveys from time to time. The first quarter (Q1) is from January to March, Q2 is from April to June, Q3 is from July to September, and Q4 is from October to December.
*2: Four companies: Obayashi Corporation, Kajima Corporation, Shimizu Corporation, and Taisei Corporation.
*3: The price of standard concrete with a nominal strength of 18.