Cost Management Report
October-December 2024 issue.
「Construction Volume Decrease Fails to Narrow Labor Supply-Demand Gap」
Scroll Down
This report has been prepared by the Cost Management Group of the Architectural Design Dept. of Nikken Sekkei Ltd for information purposes. While the information in this report is current as of the date of publication, its completeness is not guaranteed. The contents are subject to change without notice. Unauthorized reproduction of this report is prohibited.
Construction Volume Decrease Fails to Narrow Labor Supply-Demand Gap
Real construction investment and floor space starts face declining trends
A shortage of workers and work style reforms fuel the declining labor input trend
-
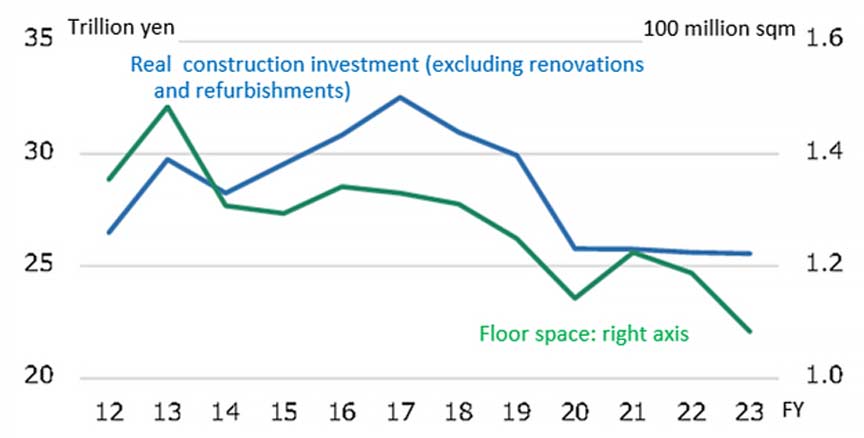 Fig. 1: Real Construction Investment and Construction Start Floor Area
Compiled from the Ministry of Land, Infrastructure, Transport and Tourism (MLIT)’s Statistical Survey of Construction Starts and Construction Investment Outlook. -
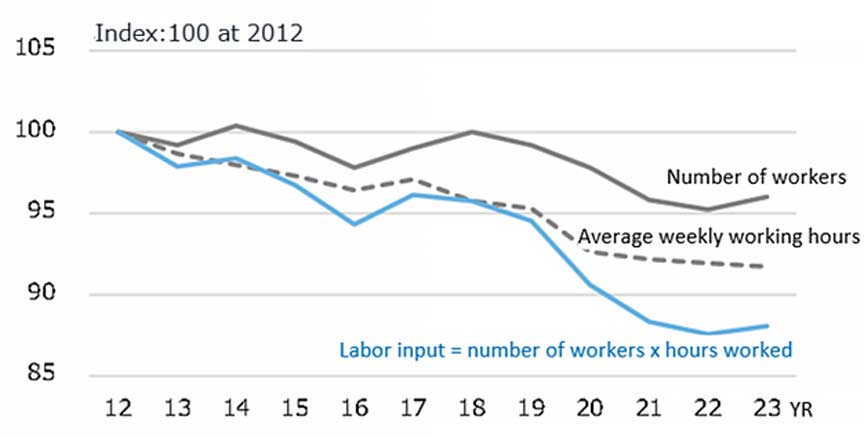 Fig. 2: Trends in Labor Input (= Number of Workers x Working Hours)
Compiled from the Statistics Bureau of Japan’s Labor Force Survey.
Increased labor input per floor area is one factor contributing to higher construction unit costs
The labor demand-supply gap is widening due to the increase in construction project scales
-
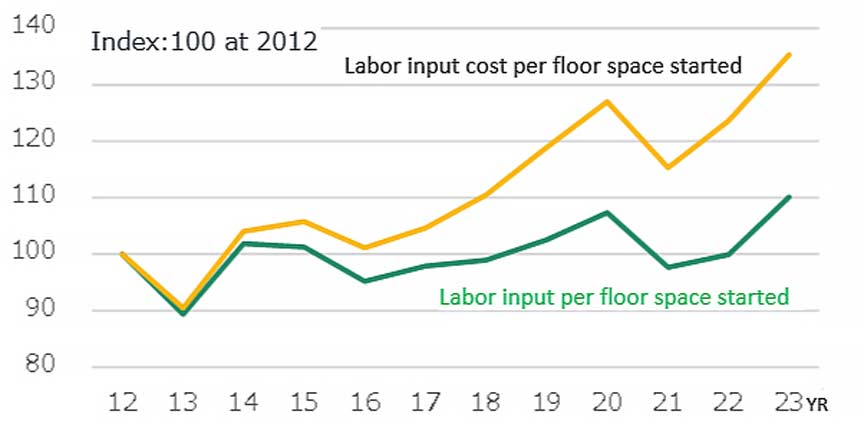 Fig. 3: Trends in Labor Input and Cost Per Floor Area for Construction Starts
Compiled from the Ministry of Health, Labour and Welfare (MHLW)’s Monthly Labor Survey, the Ministry of Internal Affairs and Communications (MIC)’s Labor Force Survey, and the Ministry of Land, Infrastructure, Transport and Tourism (MLIT)’s Survey of Construction Starts. Figures for floor space are based on annual totals. -
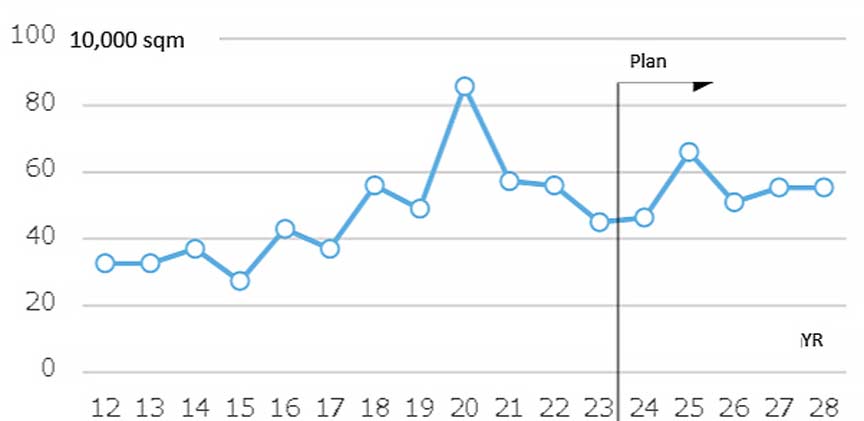 Fig. 4: Trends in the supply of office space of 100,000 sqm or more per property in Tokyo‘s 23 wards (moving average for the last three years)
Figures are based on Mori Building's Survey of Market Trends for Large Office Buildings in the 23 Wards of Tokyo.
Construction Slackens Slightly, but MEP Momentum Stays Strong, while Overall Construction Costs Continue to Rise
Nikken Sekkei Building Price Index (NSBPI)*1
In addition to increases in labor, specialty construction costs and price revisions by equipment manufacturers, the cost ratio is also rising for MEP construction. In particular, subcontractors in the Kansai region are becoming more selective about orders in anticipation of large-scale projects such as IRs (integrated resorts) after Expo 2025; their estimates continue to be more bullish than those of other regions.
Regarding construction work, prices for temporary construction, framing and finishing work rose overall, but those for reinforcing steel, steel frame materials, and other materials were on a downward trend. Some construction types saw flat or declining prices, which tempered the upward momentum of the overall construction market.
-
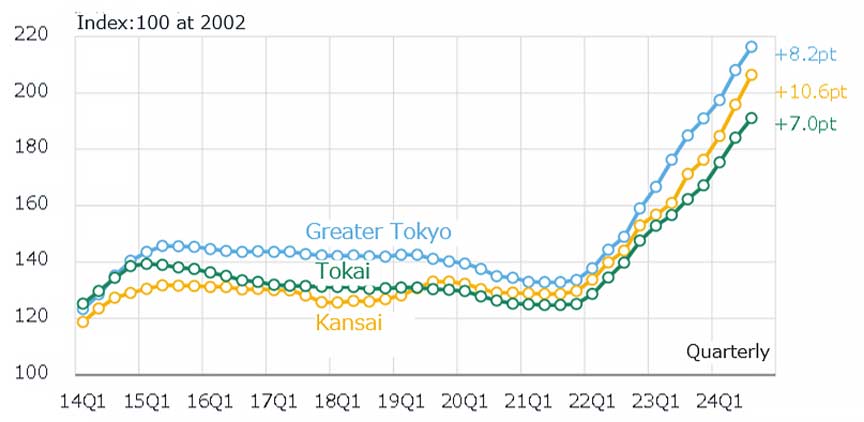 Fig. 5: Changes in NSBPI
-
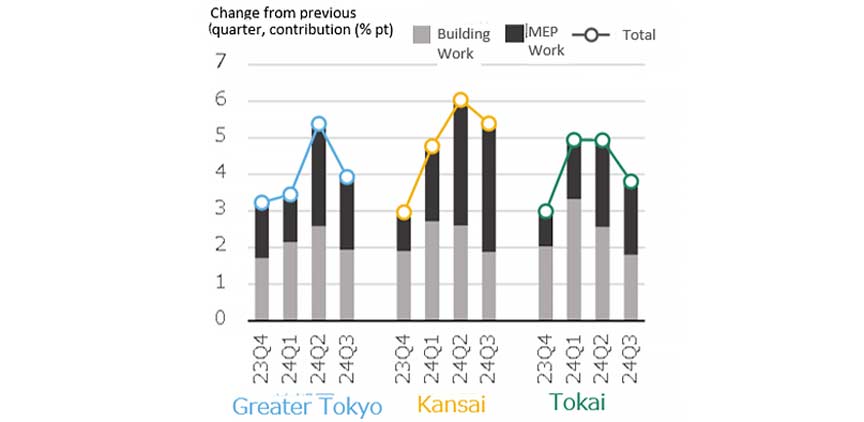 Fig. 6: % Change in NSBPI, Construction Work vs. MEP Work Contribution
Wage hikes are underway to boost the labor environment
Signs of steel price cuts appear
-
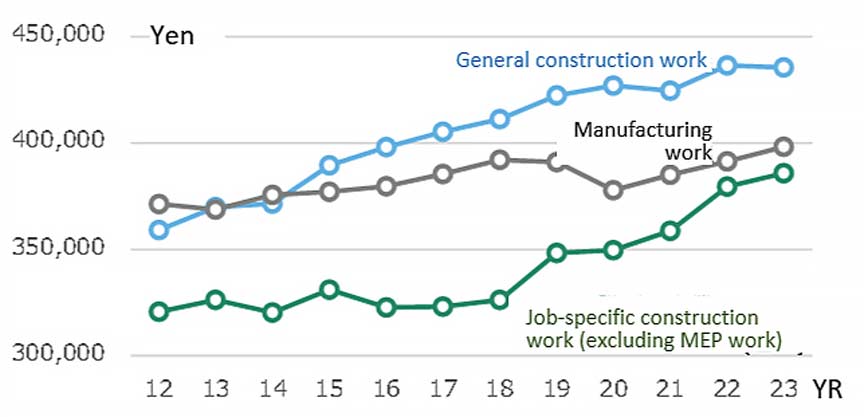 Fig. 7: Monthly Cash Salaries in the Construction Industry
Compiled from the Ministry of Health, Labour and Welfare (MHLW)’s
Monthly Labor Survey. -
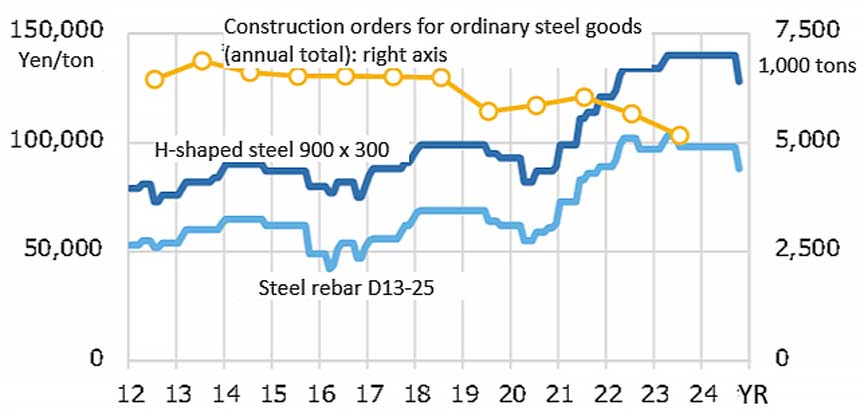 Fig. 8: Steel Price Trends (Tokyo Steel) & Construction Orders for Steel Products
Compiled from The Japan Iron and Steel Federation (JISF)’s Monthly Steel Supply and Demand Statistics, Orders for Ordinary Steel Products by Application (Domestic Demand), and Tokyo Steel Corporation’s Sales Prices report.
*1: The Nikken Sekkei Standard Building Price Index (NSBPI) shows movements in construction prices, calculated independently by Nikken Sekkei Ltd. Using standard rental office space as a quantitative model, the index is calculated and converted into an index of construction prices that reflect prevailing prices, as identified through independent surveys from time to time. The first quarter (Q1) is from January to March, Q2 is April - June, Q3 is July - September, and Q4 is October - December.