Cost Management Report
July-September 2025 issue.
「The Supply-and-Demand Gap Between Labor and Construction Capacity Persists; Some Signs of a Turning Point Appear」
Scroll Down
This report has been prepared by the Cost Management Group of the Architectural Design Dept. of Nikken Sekkei Ltd for information purposes. While the information herein is current as of the date of publication, its completeness is not guaranteed. The contents are subject to change without notice. Unauthorized reproduction of this report is prohibited.
The Supply-and-Demand Gap Between Labor and Construction Capacity Persists; Some Signs of a Turning Point Appear
Construction material prices remain stable
The supply-demand gap for labor is widening
-
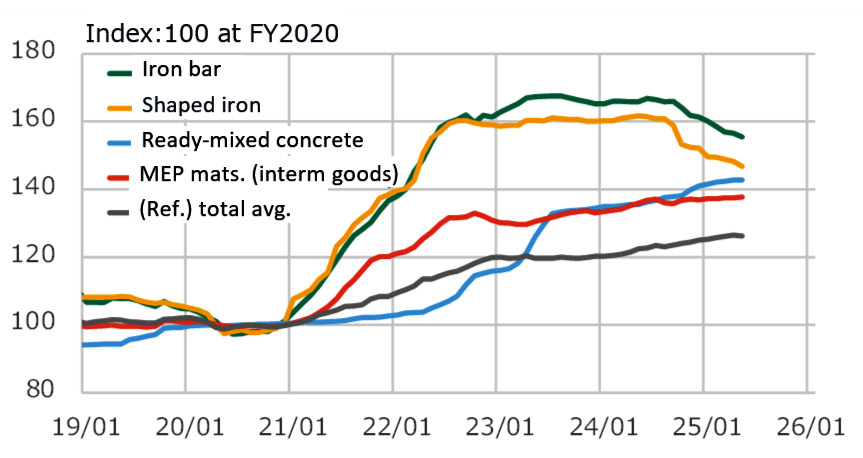 Fig. 1: Trend in materials prices
Created using data from the Bank of Japan's Corporate Goods Price Index.
-
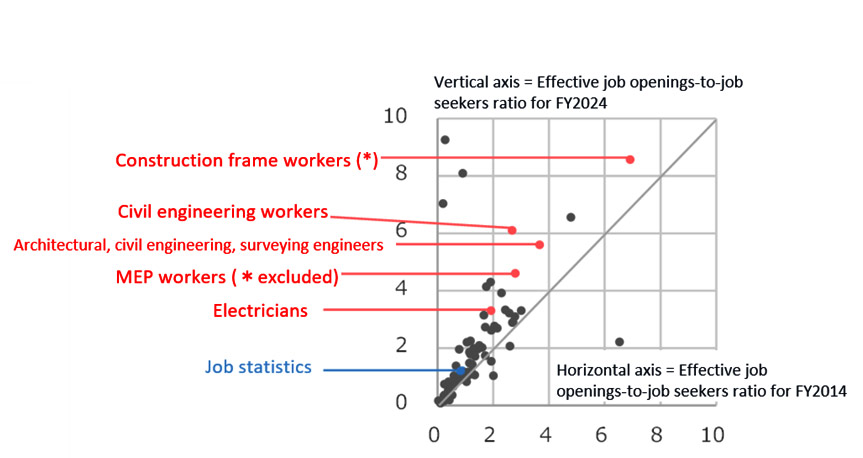 Fig. 2: Effective job vacancy ratios for FY2014 and FY2024
Created using data from the Ministry of Health, Labour and Welfare's (MHLW) General Employment Situation (Employment Security Statistics).
The gap between construction capacity supply and demand remains high
Differences between initial forecasts and actual construc-tion profit margins have narrowed
-
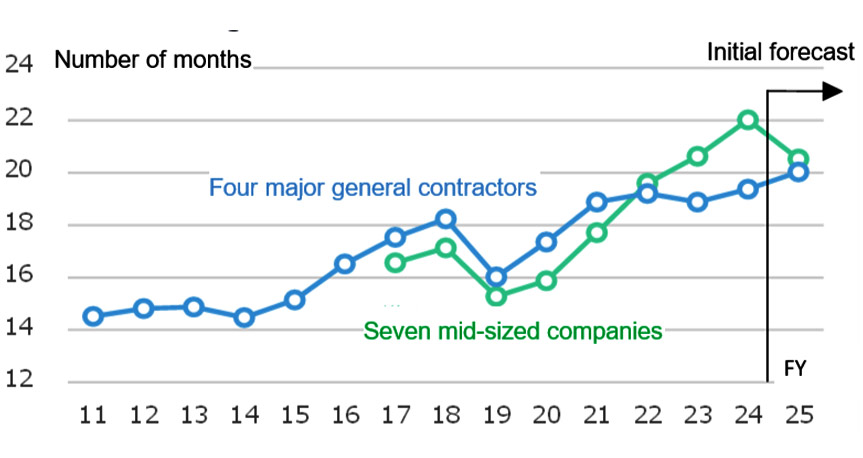 Fig. 3: Monthly value of work-in-progress for major and mid-sized general contractors
Compiled from each company's financial statements. Calculated by dividing the value of work in progress by annual sales (three-year moving average), multiplied by 12 months. -
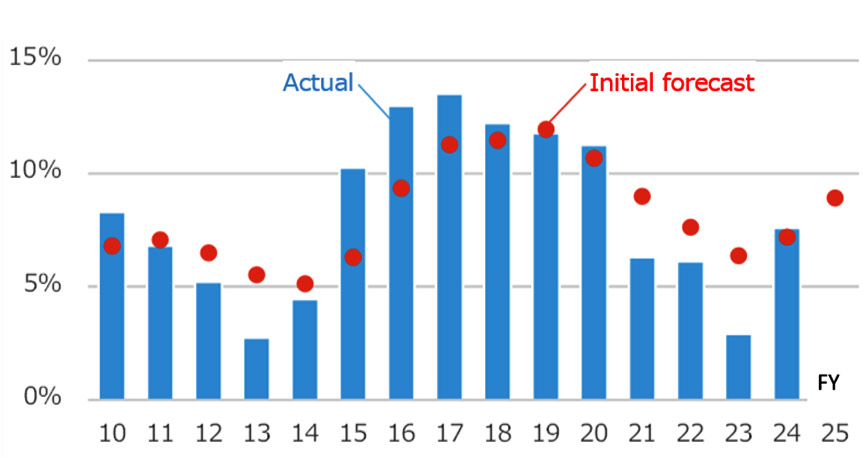 Fig. 4: Avg. completion profit margins at four major general contractors
Prepared from each company's financial data.
Quarter-on-Quarter Growth Rates Remain Around 2% in all Regions
Nikken Sekkei Standard Building Price Index NSBPI *3
-
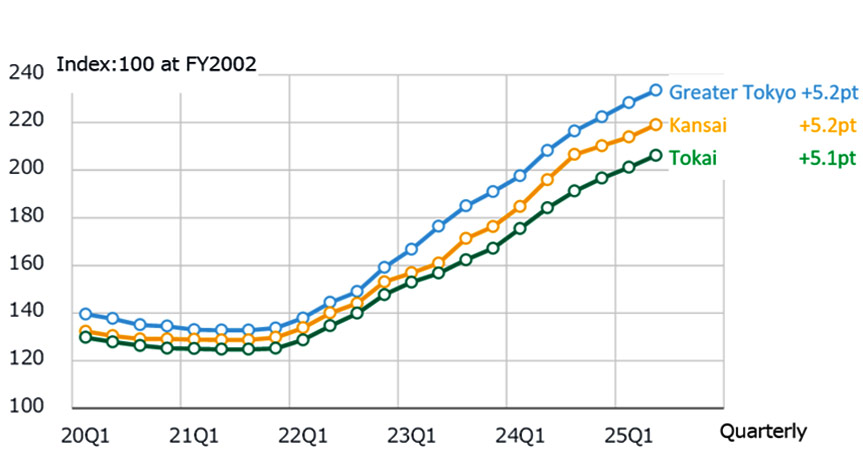 Fig. 5: Change in NSBPI
-
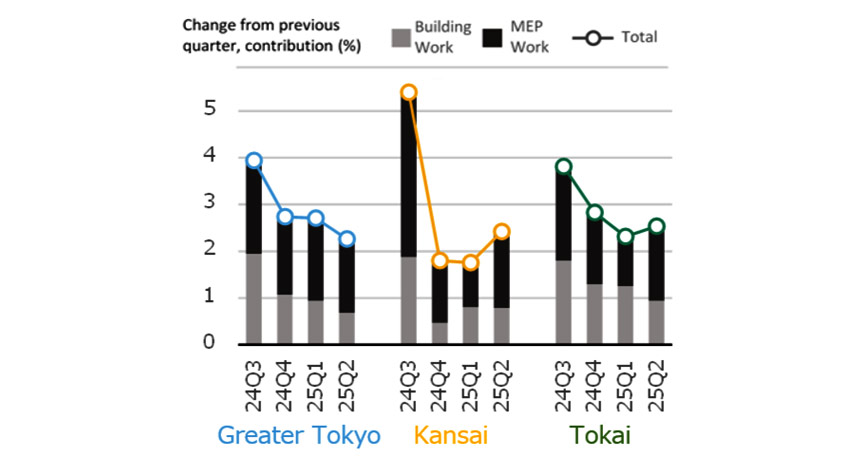 Fig. 6: Percent Change in NSBPI & Building Work, MEP Work Contributions
Labor input decreased in 2024
Both worker count and working hours decreased
The US dollar-denominated NSBPI increased
-
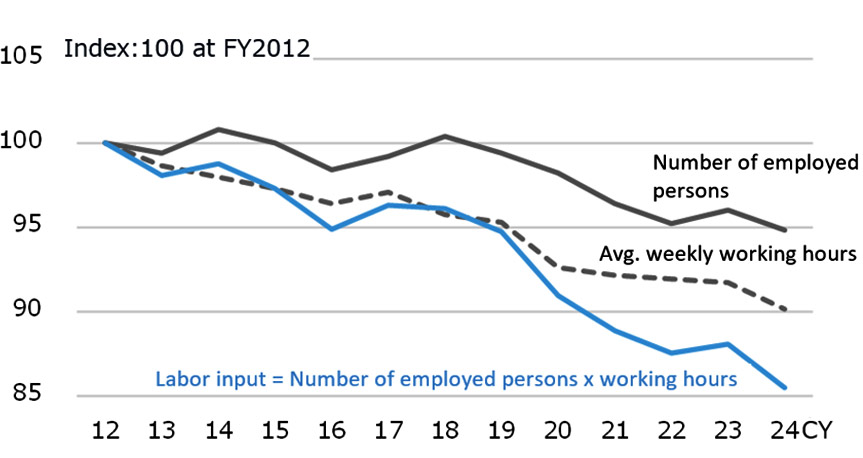 Fig. 7: Trend in Labor Input (= Employee Count × Working Hours)
Compiled from the Ministry of Internal Affairs and Communications’ (MIC) Labor Force Survey.
-
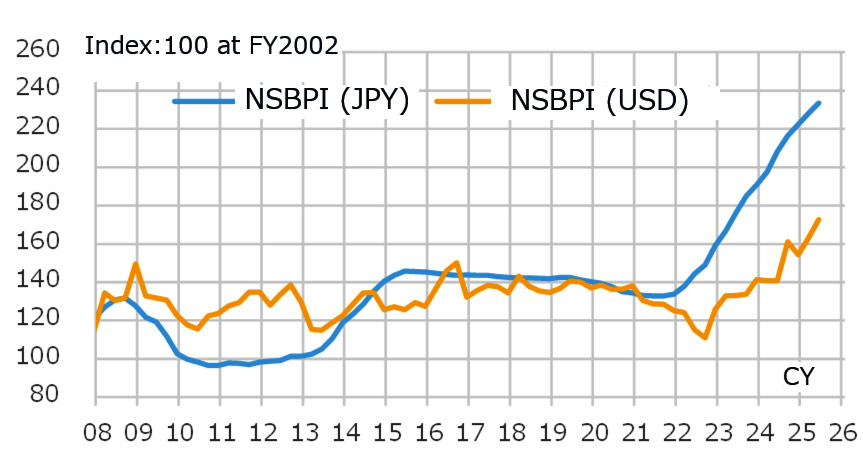 Fig. 8: NSBPI (US dollar-denominated)
Created based on Nikken Sekkei data and the Bank of Japan’s exchange rates. The US dollar-denominated index is calculated using the Sept. 2008 exchange rate as its base.
*1: Four companies: Obayashi Corporation, Kajima Corporation, Shimizu Corporation and Taisei Corporation.
*2: Seven companies: Hazama Ando Corporation, Kumagai Gumi Co., Ltd., Penta-Ocean Construction Co., Ltd., Tokyu Construction Co., Ltd., Toda Corporation, Nishimatsu Construction Co., Ltd., and Maeda Corporation. Haseko Corporation was excluded because it has a larger share of the condominium sector compared to other companies. Sumitomo Mitsui Construction Company, Ltd. was excluded because its performance forecast for fiscal 2025 was not disclosed.
*3: Nikken Sekkei Standard Building Price Index (NSBPI): An index showing price movements in construction prices, calculated independently by Nikken Sekkei Ltd. Using standard rental office space as a quantitative model, the index is calculated and converted into an index of construction prices that reflect prevailing prices, as identified through independent surveys from time to time. The first quarter (Q1) is from January to March, Q2 is from April to June, Q3 is from July to September, and Q4 is from October to December.