Cost Management Report
April-June 2025 issue.
「Soaring Construction Costs Hit a Lull, but the Rate of Increase Holds Steady」
Scroll Down
This report has been prepared by the Cost Management Group of the Architectural Design Dept. of Nikken Sekkei Ltd for information purposes. While the information herein is current as of the date of publication, its completeness is not guaranteed. The contents are subject to change without notice. Unauthorized reproduction of this report is prohibited.
Soaring Construction Costs Hit a Lull, but the Rate of Increase Holds Steady
Despite a lull, construction costs continue higher
The rate of cost increases remains the same as in the previous period
-
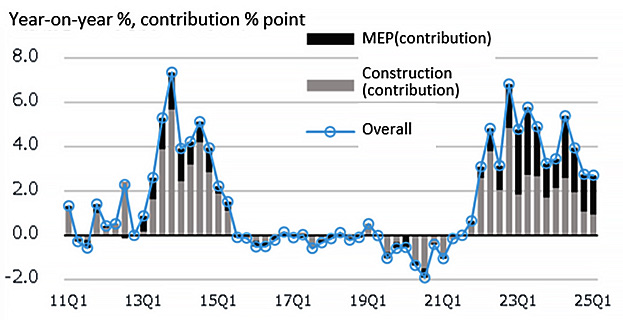 Fig. 1: Change in NSBPI *1 from the previous quarter
Prepared by Nikken Sekkei.
-
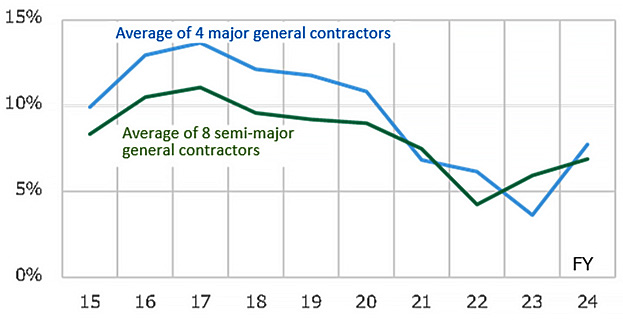 Fig. 2: Trends in average profit margin on completed construction contracts at major and semi-major general contractors
Figures for FY2024 are year-end estimates based on 3Q financial results.
Increasing awareness of price hikes and price shifting
Ready-mixed concrete prices are rising even as demand declines due to supply shortages
-
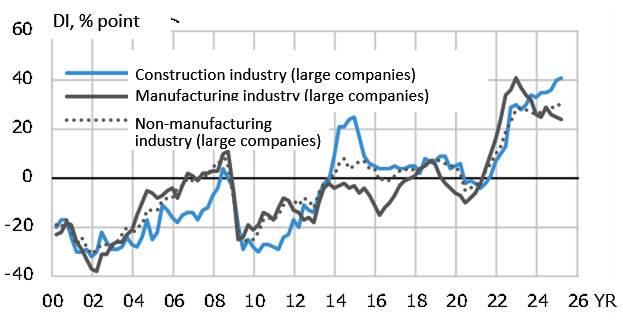 Fig. 3: Trends in sales price DIs for construction, manufacturing, and non-manufacturing industries
Compiled from the Bank of Japan's National Survey of Enterprises and Short-Term Economic Outlook. -
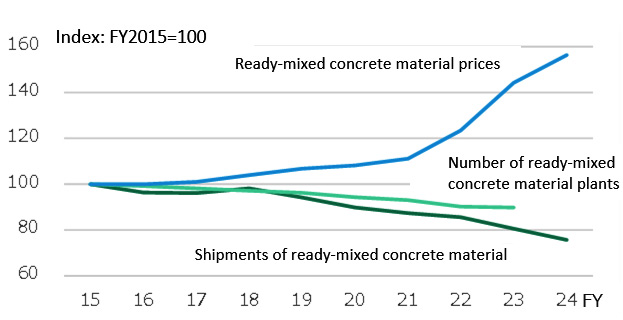 Fig. 4: Trends in ready-mixed concrete material prices, number of plants, and volume of shipments
Prepared from Concrete Industry Trends by the National Federation of Ready-mixed Concrete Industry Associations and National Federation of Ready-mixed Concrete Cooperative Association (ZENNAMA), and from the Economic Research Association’s Estimated Materials. Shipment volume in FY2024 is forecasted and indexed, based on the actual Apr-Jan volume.
Cost Rises Slacken in Greater Tokyo, Kansai Regions
Nikken Sekkei Standard Building Price Index NSBPI *1
In the area of building construction, cost rises continued in temporary, frame, and finishing work in general. However, the momentum of the rise slowed from the previous quarter -- except for some categories such as temporary and concrete-related work. Rebar prices are likely to remain flat due to higher processing, assembly and other labor-related costs, although materials prices will continue to fall.
Regarding MEP work, labor costs, specialized construction costs, and expense ratios continue to rise. Compared to the greater Tokyo metropolitan area, upward price pressure was weak in Kansai, a trend similar to 2024. Some equipment prices are scheduled to be revised in the new fiscal year, so it is necessary to keep a close eye on how they will be reflected in price quotes.
-
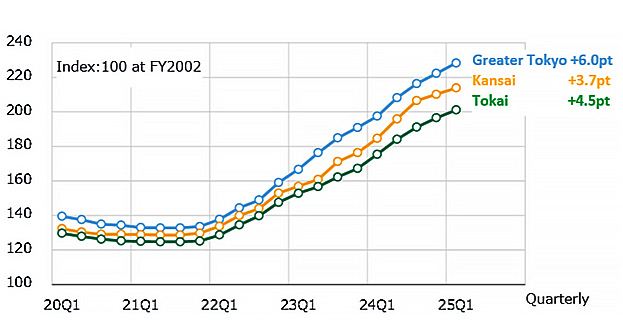 Fig. 5: Change in NSBPI
In both Figures 5 and 6, the index for 25Q1 was set after revising the index for 24Q4 in the Kansai region*4.
-
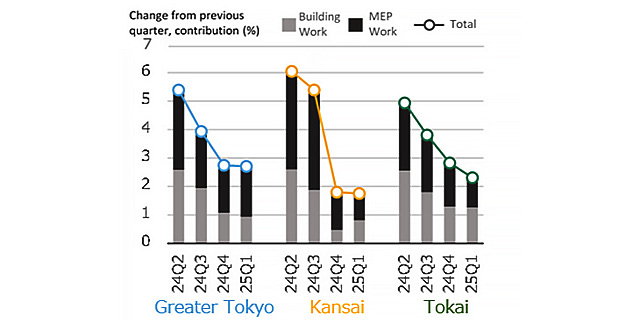 Fig. 6: Percent Change in NSBPI & Building Work, MEP Work Contributions
Steel prices remain flat, but select steel products see price cuts
The sense of a labor shortage continues to intensify in the con-struction industry
-
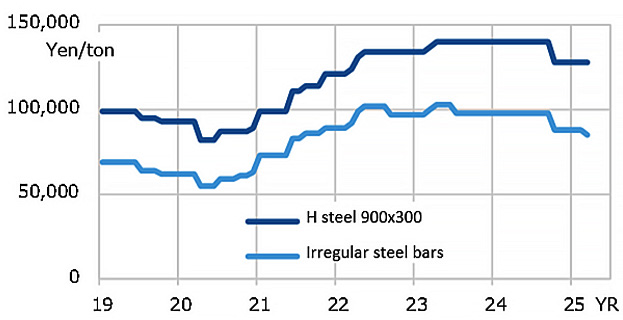 Fig. 7: Steel Sales Price (Tokyo Steel)
Prepared from Tokyo Steel’s sales prices of Tokyo Steel.
-
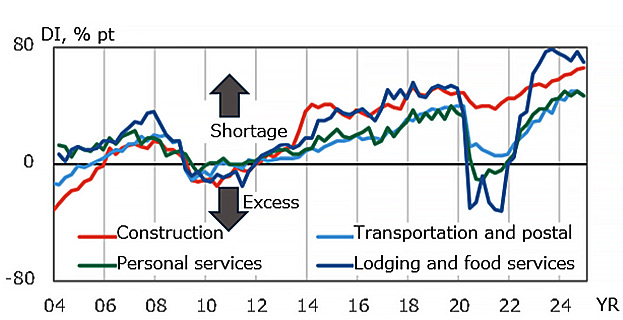 Fig. 8: DI for Employment (Large Companies)
Compiled from Bank of Japan’s National Survey of Enterprises and Short-Term Economic Outlook.
*1: Nikken Sekkei Standard Building Price Index (NSBPI): An index showing price movements in construction prices, calculated independently by Nikken Sekkei Ltd. Using standard rental office space as a quantitative model, the index is calculated and converted into an index of construction prices that reflect prevailing prices, as identified through independent surveys from time to time. The first quarter (Q1) is from January to March, Q2 is from April to June, Q3 is from July to September, and Q4 is from October to December.
*2: Four companies: Obayashi Corporation, Kajima Corporation, Shimizu Corporation and Taisei Corporation.
*3: Hazama Ando Corporation, Kumagai Gumi Co., Ltd., Penta-Ocean Construction Co. Ltd., Tokyu Construction Co., Ltd., TODA CORPORATION, Nishimatsu Construction Co., Ltd. , Maeda Corporation, Sumitomo Mitsui Construction Company, Ltd. HASEKO Corporation was excluded from the index due to its greater weight in the condominium sector compared to other companies.
*4: The 24Q4 index figures for the NSBPI Kansai region were revised downward as follows.
Before revision: Index = 211.1, +4.6 pts year-on-year, +2.2% (contribution ratio: construction 0.5, MEP: 1.7).
After revision: Index = 210.2, +3.7 pts year-on-year, +1.8% (contribution: construction 0.5, MEP: 1.3).