

Cost Management Report, January-March 2020
"Private construction investment decreased in 2020 (compared to last year)."
"Intensified price competition has led to a gradual decline in construction prices."
SCROLL DOWN
The “Cost Management Report” (quarterly) provides an overview of domestic and international economic conditions and, drawing on a wealth of cost data derived from our track record as the leading architectural firm in market share, delivers timely, independent analyses of the construction market from a neutral perspective.
*This report is prepared by Nikken Sekkei Cost Management Group for the purpose of providing information only. The contents are as of the date of creation and do not guarantee completeness and are subject to change without notice.



Private construction investment decreased in 2020 (compared to the previous year).
Intensified price competition has led to a gradual decline in construction prices.
Private sector capital investment slows down, leading to a decrease in building floor area started.
*Business Conditions DI: An economic sentiment index published in the Bank of Japan’s Short-Term Economic Outlook Survey (Tankan), calculated by subtracting the percentage of companies that perceive economic conditions as “poor” from the percentage that perceive them as “good.”
-
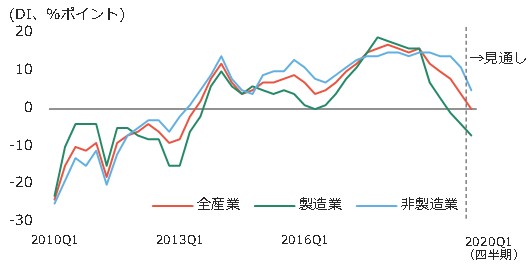 Figure 1: Trends in the DI (diffusion index) for business conditions
Source: BOJ “TANKAN” -
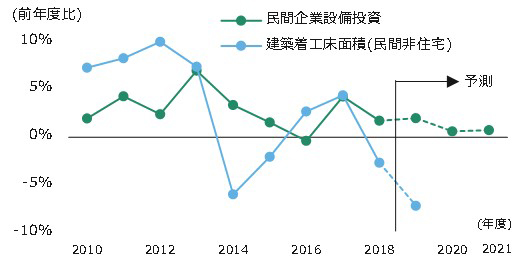 Figure 2: Percentage change in real private capital investment and building starts (private non-residential)
Sources: Cabinet Office “Preliminary Quarterly GDP Figures,” Japan Economic Research Center “Quarterly Economic Forecast,” Ministry of Land, Infrastructure, Transport and Tourism “Survey on Building Starts”
*The 2019 figure for the area in the Construction Starts Statistics was calculated by comparing the April–October period.
Construction orders for the first half of fiscal year 2019 got off to a slow start.
*Order Target Achievement Rate: The ratio of actual order volume to the target order volume set at the beginning of the period
From sole-source contracts to competitive bidding
-
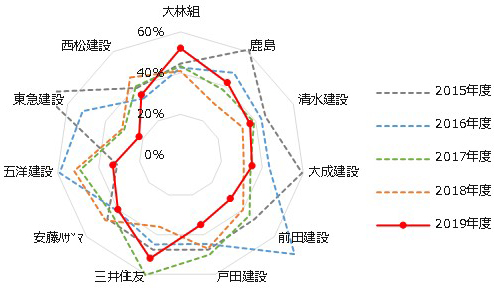 Figure 3: Achievement rate of construction order targets for the first half of the year
Source: Compiled from each company’s financial statements -
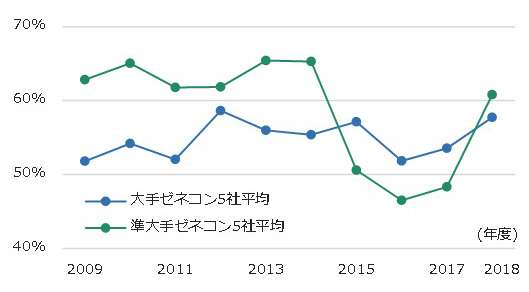 Figure 4: Trends in the percentage of competitive bids for construction companies
Source: Compiled from each company’s financial statements
*Mid-sized general contractors: Maeda Corporation, Toda Corporation, Sumitomo Mitsui Construction, Kumagai Gumi, and Tokyu Construction (5 companies)
Tokyo metropolitan area: Both building and equipment prices are on a gradual downward trend.
Kansai region: The rise has paused. Tokai region: A gradual downward trend is underway.
What is the Nikken Sekkei Standard Construction Cost Index (NSBPI)?
The Nikken Sekkei Standard Construction Cost Index is an index calculated by using a standard rental office as a quantity model and reflecting the actual market price based on Nikken Sekkei's own research in a timely manner.
With 2002 set as 100, the first quarter is January-March, the second quarter is April-June, the third quarter is July-September, and the fourth quarter is October-December.
Trends in construction costs
Kansai Region: The upward trend seen until last quarter has paused. While equipment construction costs are trending downwards in some projects, overall they remain largely flat.
Tokai region: Although the rate of decline from the previous period narrowed (-0.5pt to -0.3pt compared to the previous period), the gradual downward trend continues in both building construction and equipment construction.
-
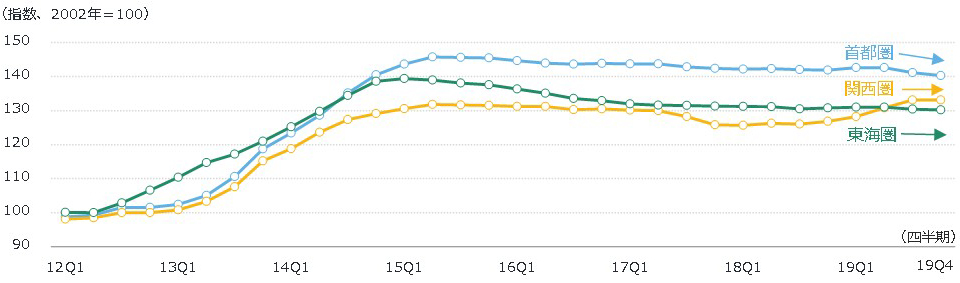 Figure 5: Trends in NSBPI (Nikken Sekkei Standard Construction Cost Index)
-
 Figure 6 shows the percentage change in NSBPI (Nikken Sekkei Standard Building Cost Index) and the contribution of building and equipment.
A gradual decline in steel frame demand is driving down prices.
Equipment labor costs, equipment prices, and specialized construction costs are falling.
-
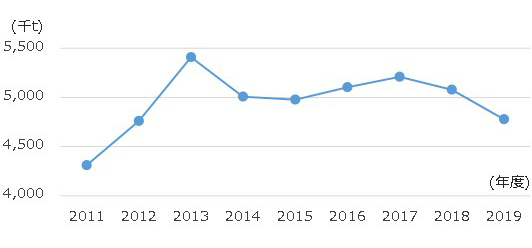 Figure 7 Estimate of steel frame demand
Source: Ministry of Land, Infrastructure, Transport and Tourism, “Survey on Building Starts”
*Steel usage is calculated based on the floor area of new steel-frame (S) construction × 100 kg and the floor area of new steel-reinforced concrete (SRC) construction × 50 kg
*For the period from November 2019 to March 2020, estimates were based on the assumption that the floor area of new construction starts would be the same as in the same period of the previous year -
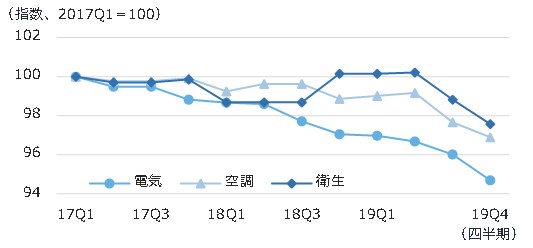 Figure 8: Trends in NSBPI Index for Equipment (Tokyo Metropolitan Area)
Source: Nikken Sekkei