
To view the report, please select the industry or sector to which your company belongs.

Selecting this option will display the next level of industry/sector selection.

Cost Management Report


「Monitoring the Impact of Rising Materials Prices on Construction Costs」

SCROLL DOWN

The “Cost Management Report” (quarterly) provides an overview of domestic and international economic conditions and, drawing on a wealth of cost data derived from our track record as the leading architectural firm in market share, delivers timely, independent analyses of the construction market from a neutral perspective.

*This report was prepared by the Cost Management Group of the Quality Control Division of Nikken Sekkei Ltd for informational purposes. The contents of this report are current as of the date of preparation, and its completeness is not guaranteed. The contents are subject to change without notice. Unauthorized reproduction of this report is prohibited. CATEGORY Solution RELATED EXPERTISE Solution share     

Monitoring the Impact of Rising Materials Prices on Construction Costs

Construction industry business sentiment: no sign of upturn

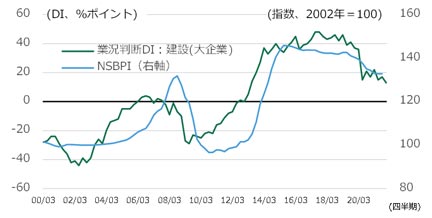
Construction industry business confidence has been flat since it fell sharply in June 2020. A correlation exists between the NSBPI (Nikken Sekkei Building Price Index) and business sentiment in the construction industry as the NSBPI tends to fall when business sentiment falls. Currently, in line with this correlation, with the fall of business sentiment, the NSBPI continues to gradually fall off (Figure 1).

Construction materials prices: sharp rise

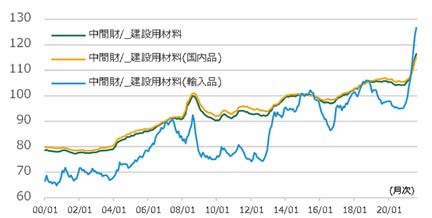
Looking at the prices index investigating the price trend of construction materials, a slow rise that continued since 2000 has risen rapidly after January 2021 (Figure 2). Intermediate goods consisting of concrete, steel, lumber, glass, sashes, plastic products, wiring and piping, etc. for construction indicate that upward pressure on material prices is increasing overall.
  • Figure 1: Trends in the DI (diffusion index) for business conditions Figure 1: Trends in the DI (diffusion index) for business conditions
    Source: Bank of Japan, “Nationwide Survey of Enterprises and the Short-Term Economic Outlook”

  • Figure 2: Changes in the Corporate Goods Price Index Figure 2: Changes in the Corporate Goods Price Index
    Source: Bank of Japan, “Corporate Goods Price Index by Demand Type and Use”

A series of materials price hikes

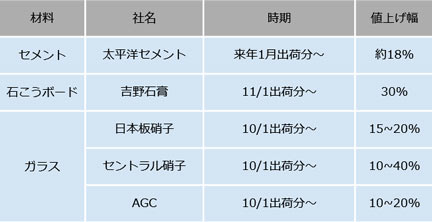
As materials prices have been increasing and due to the addition of rising logistics costs, manufacturers are announcing price hikes (Figure 3) . Companies other than those listed in Figure 3, Sangetsu (wall and flooring materials), Daiken (flooring materials), Asahi Kasei Construction Materials and Clion (ALC), etc. have also announced price escalations, which pushes remaining manufacturers to follow.
 

Divergence between sales prices and purchase prices

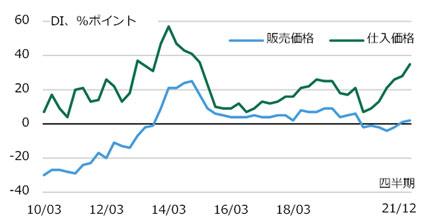
Rising materials prices will normally affect construction industry purchase prices. The Bank of Japan's Tankan survey (short-term economic outlook) of purchasing prices (large construction companies) shows that the DI (diffusion index) has been rising since June 2020. In contrast, the DI for sales prices has remained flat, with the gap between purchase prices widening (Figure 4). If the purchase prices continue to rise, even in the context of declining business sentiment, builders may not be able to absorb them despite their best efforts and this will ultimately be reflected in price quotes even for competitive projects, which will result in higher construction prices.
  • Figure 3: Trends in materials price increases Figure 3: Trends in materials price increases
    Source: Compiled from various press releases

  • Figure 4: DI for Sales Price & Purchase Price Judgments: Big Construction Firms Figure 4: DI for Sales Price & Purchase Price Judgments: Big Construction Firms
    Source: Bank of Japan's National Survey of Enterprises and the Economy
    DI = % of firms that judged prices to rise MINUS % of firms that judged prices to fall

NSBPI Unchanged from Prior Quarter in All Three Regions

Nikken Sekkei Standard Building Price Index NSBPI

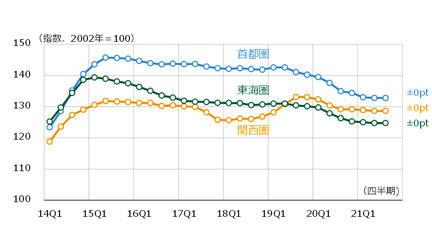
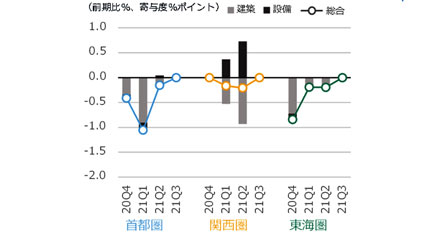
The overall price indexes for the Tokyo metropolitan area, the Kansai region, and the Tokai region remain unchanged from the previous quarter. Although the prices of materials such as steel and electrolytic copper continue to rise, the NSBPI has yet been pushed up due to strong pressure on order competition.
  • NSBPI Trends NSBPI Trends

  • % change in NSBPI and contribution of construction and equipment % change in NSBPI and contribution of construction and equipment

Steel prices have risen 9% from the previous newsletter (June)

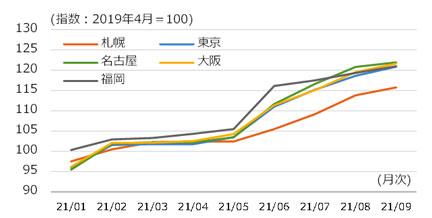
Steel prices have not stopped rising. Compared to the previous issue of this newsletter (June), prices in Tokyo, Nagoya, and Osaka have risen by 9%, by 10% in Sapporo and by 4% in Fukuoka, showing that the higher prices continue (Figure 7). The price of steel scrap as a raw material continues to rise due to demolition work stagnation and continued monitoring on price escalation is needed.

The labor shortage remains at a low level, having no effect on labor costs

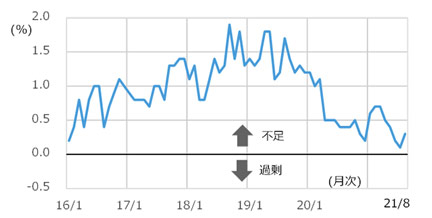
Since April 2020, the labor shortage has eased and remains at a low level (Figure 8). Figure 8 shows the excess/shortage of labor rate for eight jobs. Amongst these, the plasterer shortage rate is as high as +1.2%, while the formworker and rebar worker shortage rates are low at -0.1% and -0.9% (excess) respectively. The overall shortage remains low, however, the number of construction workers is decreasing as the Japanese population ages so that labor costs are unlikely to downturn further.
  • Figure 7: Trends in steel prices (ordinary steel) Figure 7: Trends in steel prices (ordinary steel)
    Source: Economic Research Institute “Construction Materials Price Index.”

  • Figure 8: Trends in the excess/shortage ratio of skilled construction workers Figure 8: Trends in the excess/shortage ratio of skilled construction workers
    Source: Ministry of Land, Infrastructure, Transport and Tourism, "Survey of Construction Labor Supply and Demand” (total of 8 occupational categories, nationwide, seasonally adjusted).

This site uses cookies. By continuing to use this website, you consent to the use of cookies.Our policy.